When you boil it all down, the average cost of residential solar energy shakes out to be between 5 and 15 cents per kWh. This number isn't just a guess; it's calculated over the entire lifespan of the system. For most homeowners, this long-term price is a welcome relief compared to standard utility rates, offering a predictable and much more affordable way to power their lives.
Understanding the True Cost of Solar Energy Per kWh
So, when you ask, "how much does solar energy cost per kWh?" what you're really asking for is the true price of the electricity your panels will generate for years to come. It’s easy to get hung up on the initial installation price, but that's a bit like judging a car's total value just by its sticker price, completely ignoring its fuel economy for the next decade.
To get a real, apples-to-apples comparison, we need to look at something called the Levelized Cost of Energy (LCOE).
Think of LCOE as the "price per gallon" for the power your solar system produces over its entire 25+ year lifespan. It takes that big upfront investment and spreads it out over every single kilowatt-hour your panels will ever generate. This gives you a simple, clear rate you can directly compare to your monthly utility bill.
Why LCOE Matters More Than Upfront Cost
Fixating only on the initial price tag can be a trap. A cheaper, lower-quality system might seem like a great deal at first, but if it produces less power and wears out faster, its actual cost per kWh (its LCOE) could end up being higher than a more expensive, high-efficiency system.
The goal isn't just to buy panels; it's to generate the cheapest possible electricity over the long haul. LCOE helps you see past the initial check you write and focus on the lifetime value and savings.
Grasping this concept is key. It reframes solar from a one-time expense into what it really is: a long-term investment in your own personal power plant, one that produces clean energy at a locked-in, low rate.
To put these numbers into perspective, let's look at a quick comparison.
Average Solar Cost Per kWh at a Glance
graph TD
    subgraph Legend
        direction LR
        Solar[Solar Cost]
        Utility[Utility Cost]
    end
    subgraph Residential Cost Per kWh
        direction LR
        A[Solar: $0.05 - $0.15] --> B[Utility: $0.17 - $0.25+]
    end
    subgraph Utility-Scale Cost Per kWh
        direction LR
        C[Solar: $0.03 - $0.05] --> D[Sells to Grid]
    end
    style Solar fill:#f9d71c,stroke:#333,stroke-width:2px
    style Utility fill:#add8e6,stroke:#333,stroke-width:2px
This table provides a quick summary of typical solar energy costs per kWh, comparing residential and utility-scale systems to average utility electricity rates.
| Solar System Type | Average Cost Range per kWh (LCOE) | Typical Utility Rate per kWh |
|---|---|---|
| Residential Solar | $0.05 – $0.15 | $0.17 – $0.25+ (Varies by state) |
| Utility-Scale Solar | $0.03 – $0.05 | N/A (Sells power to the grid) |
As you can see, even on a small residential scale, solar's long-term cost per kWh is already competitive with—and often significantly lower than—what you're currently paying the utility company.
A Look at Declining Solar Costs
The best part for homeowners is that the cost of going solar has absolutely plummeted over the last decade. While this trend is most dramatic in massive, utility-scale projects, the ripple effect benefits everyone.
Globally, the weighted-average LCOE for big solar farms dropped from a staggering $0.417/kWh in 2010 to just $0.043/kWh in recent years. If you're a data nerd, you can dive into the reports on this incredible energy shift at the International Renewable Energy Agency's website.
xychart-beta
    title "Global Decline in Utility-Scale Solar Cost (LCOE)"
    x-axis "Year" [2010, 2012, 2014, 2016, 2018, 2020, 2022]
    y-axis "Cost per kWh ($)" [0, 0.1, 0.2, 0.3, 0.4, 0.5]
    line [0.417, 0.250, 0.160, 0.100, 0.068, 0.055, 0.043]
This massive price drop has made solar more accessible than ever, giving regular homeowners the power to lock in electricity rates far below what utility companies are expected to charge years from now. By calculating your own potential LCOE, you can see exactly when your system will pay for itself and start generating pure, unadulterated savings.
Breaking Down Your Total Solar System Investment
When you get a quote for a solar installation, it’s natural to focus on the big-ticket items—the panels themselves. But the final price tag is actually a mix of physical hardware and the crucial services needed to get it all up and running. Getting a handle on this breakdown is the key to understanding where your money is really going.
First up are the hard costs. This is all the tangible equipment you can see and touch. We're talking about the solar panels, the inverter (which is the brain of the system, converting DC power to the AC power your home uses), and the racking that fastens everything securely to your roof. All told, this hardware usually makes up about 40% of the total system price.
Then you have the soft costs, the less obvious expenses that often account for more than half of the final bill. These are the service-based costs required to design your system, get it approved, and install it correctly. This bucket includes everything from the installation crew's labor to the permitting fees your city or county charges. It also covers the detailed engineering plans and even the installer's own business costs, like marketing and project management.
pie
    title Solar System Cost Breakdown
    "Hard Costs (Equipment)" : 40
    "Soft Costs (Labor, Permits, etc.)" : 60
This visual gives you a great snapshot of how a typical solar investment is split between equipment, labor, and other essential services.
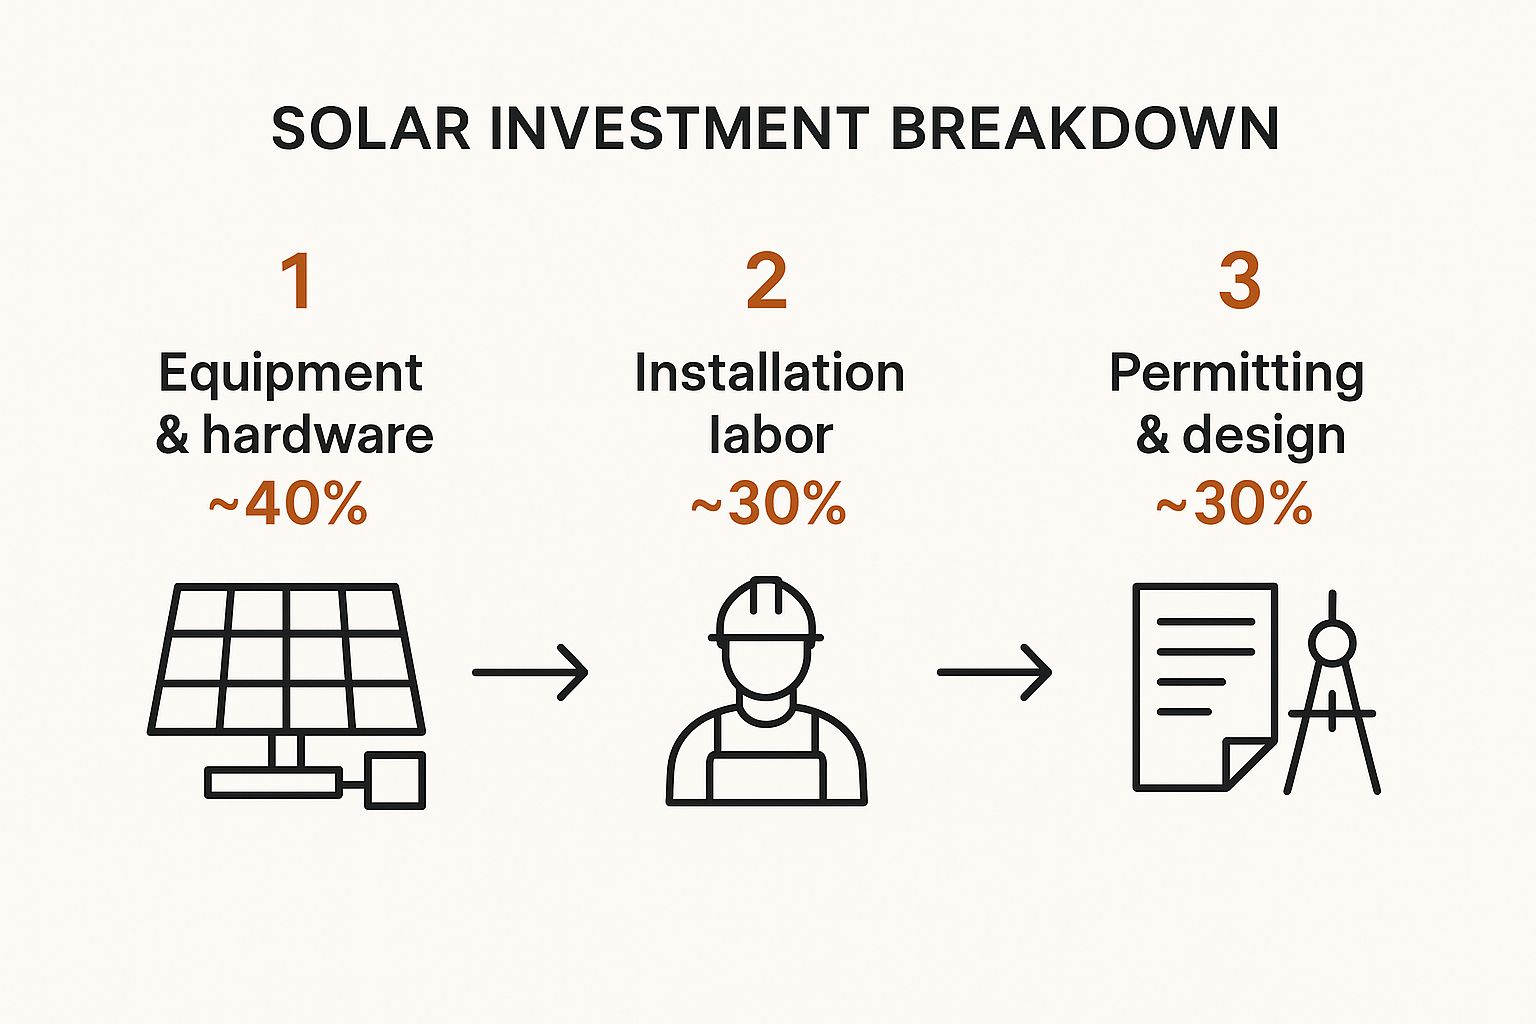
As you can see, the physical hardware is less than half the story. The labor, paperwork, and planning are what really drive the majority of the expense.
The Major Cost Components
Let’s pull these costs apart into their main categories. It’s a lot like building a new home—you’re not just paying for lumber and concrete, but also for the architect, the construction crew, and all the city permits.
-
Equipment (Hard Costs): This is the core of your system. It’s more than just the panels; the quality of your inverter and mounting hardware plays a huge role in performance and how long your system will last. You might pay more upfront for high-efficiency panels or microinverters, but they often deliver far better value over the long haul.
-
Labor & Installation (Soft Costs): A good portion of the budget goes right to the skilled professionals who get the system on your roof safely and correctly. This includes licensed electricians and experienced installers whose expertise ensures your system will perform reliably for the next 25-30 years.
-
Permitting & Inspection (Soft Costs): Before a single panel goes up, your installer has to navigate a maze of local bureaucracy. They create detailed plans, submit them to your local government for approval, and pay the associated fees. After the install, a final inspection is required to make sure everything is safe and up to code.
-
Operational & Business Costs (Soft Costs): This covers the installer's overhead—the "cost of doing business." It includes things like system design, engineering work, managing the supply chain, and sales consultations. These behind-the-scenes tasks are what make a project run smoothly from start to finish.
Understanding this division helps you read between the lines when comparing quotes. A higher price might mean you're getting better equipment, a more experienced crew, or more thorough project management—all things that heavily influence your long-term solar panel system installation cost.
At the end of the day, knowing that soft costs like labor and permitting make up around 60% of the total price helps clarify why the cost of solar isn't just about the hardware. It's a comprehensive investment in a professionally managed energy solution for your home.
How to Calculate Your Personal Solar Cost Per kWh
Alright, let's move beyond national averages and figure out what solar would actually cost you. Pinpointing your personal solar cost per kWh is the single most important step you can take. It cuts through the noise and gives you a concrete number to compare directly with what you’re paying your utility company right now.
The method for this is called the Levelized Cost of Energy (LCOE), which sounds complicated but is actually pretty straightforward.
(Total System Cost – Incentives) / (Lifetime Energy Production) = Your Cost Per kWh
Let's walk through this with a real-world example so you can see exactly how the math works in practice.
Step 1: Find Your Net System Cost
First things first, we need to figure out what you’ll actually pay for the system after all the discounts and credits. The biggest one for most homeowners is the federal solar tax credit.
Let's say you get a quote for a 6 kW system that comes in at $20,000. The federal tax credit currently lets you knock 30% of that price right off your federal tax bill.
- Total System Cost: $20,000
- Federal Tax Credit (30%): $6,000
- Your Net System Cost: $20,000 – $6,000 = $14,000
That $14,000 is your real number. It's the true out-of-pocket investment you’re looking at.
Step 2: Estimate Lifetime Energy Production
Next up, you have to project how much electricity your panels will generate over their lifetime. A standard solar panel warranty lasts for 25 years, so we'll use that as our timeframe.
A 6 kW system in a reasonably sunny spot could produce about 8,400 kWh in its first year. Of course, panels lose a tiny bit of efficiency over time—a process called degradation. A typical rate is about 0.5% per year. When you factor that in, a system like this should produce roughly 200,000 kWh over its 25-year life.
For a more precise estimate tailored to your roof and local weather, it’s a good idea to use a solar system sizing calculator.
Step 3: Calculate Your Final Cost Per kWh
Now you have the two key figures needed to solve the puzzle. Simply plug them into the formula we started with:
$14,000 (Net Cost) / 200,000 kWh (Lifetime Production) = $0.07 per kWh
Think about that for a moment. Your electricity price would be locked in at just 7 cents per kWh for the next 25 years. That’s a rate most people can only dream of getting from their utility.
In the U.S., most residential solar installations result in a levelized cost between 3 and 6 cents per kWh. It’s these incredible long-term savings, supercharged by federal incentives, that have convinced the owners of over 7.3 million homes to make the switch. This simple calculation really puts the long-term financial power of solar into perspective.
Why Location Dramatically Affects Your Solar Costs
When it comes to solar energy, your zip code is one of the biggest factors in what you'll actually pay per kWh. Think of it like real estate: location is everything. A solar panel's performance and financial payback are completely tied to where it's installed, causing the price of solar power to swing wildly from one state to another.
The most intuitive reason is, of course, the amount of sunshine you get. A home in Phoenix, Arizona, is bathed in far more direct sunlight—what experts call solar irradiance—than a home in Seattle, Washington. More sun means more electricity from the exact same equipment, which directly lowers your cost per kWh because you're squeezing more power out of your investment over the system's lifespan.

Beyond Just Sunshine
But sunlight is only half the story. The final price tag is also shaped by a mix of local economics, policies, and regulations that can be just as impactful as the weather.
- Local Labor Rates: The cost to get those panels on your roof isn't uniform across the country. Installation in an area with a high cost of living will naturally come with a higher price tag than in a more affordable region.
- Permitting and Red Tape: Some cities have made going solar a breeze with simple, straightforward permitting. Others are tangled in bureaucracy. These administrative hurdles, known as "soft costs," can easily add hundreds or even thousands of dollars to your project.
- State and Utility Incentives: This is a big one. On top of the federal tax credit, many states and even local utility companies offer their own sweeteners—rebates, extra tax credits, or performance payments. These can take a huge bite out of your upfront cost and seriously lower your final cost per kWh.
A homeowner in a state with awesome solar incentives and high electricity bills will see a much faster payback than someone in a state with neither, even if their roof gets less direct sun.
These local nuances create a complex pricing map. To illustrate, here's a look at how different regional factors can push your cost per kWh up or down.
Regional Factors Influencing Solar Cost Per kWh
| Factor | Impact on Cost per kWh | Example |
|---|---|---|
| Solar Irradiance | Higher irradiance lowers the cost. | Arizona's intense sun produces more kWh per panel than Vermont, reducing the LCOE. |
| Local Utility Rates | High rates make solar more valuable and lower the effective cost. | California's high electricity prices accelerate the breakeven point for solar owners. |
| State/Local Incentives | Strong incentives directly reduce the upfront investment. | A state rebate in Illinois lowers the net system cost, thus lowering the cost per kWh. |
| Labor Costs | Higher regional wages increase the installation portion of the cost. | An installation in San Francisco will have higher labor costs than one in rural Texas. |
| Permitting Complexity | Bureaucratic delays and high fees add to the total project cost. | A city with a slow, expensive permitting process increases the "soft costs" for an installer. |
Ultimately, a favorable combination of these factors can make solar an unbeatable deal in one area, while a less ideal mix can make the numbers a bit tighter somewhere else.
The Global Picture on Energy Costs
This isn't just a state-by-state issue; it's a global reality. While solar is becoming cheaper than the grid in many places, the starting price of that grid electricity varies enormously.
For instance, homeowners in Spain pay their utility around $0.226 per kWh. But for residents of island nations like the Cayman Islands, that number skyrockets to a staggering $0.433 per kWh because they have to import expensive fuel to generate power. You can see more of these striking global energy price differences in research compiled on solar PV statistics.
This is precisely why solar is so compelling in places with high energy costs. When your alternative is paying a fortune to the utility, locking in your own low, predictable rate with solar becomes a powerful financial strategy. To get a true sense of what solar will cost you, you have to look at the full picture: your local sunshine, labor costs, and, most importantly, the available incentives.
Comparing Solar Power vs. Traditional Utility Grid Costs
This is where the rubber meets the road—pitting your own personal power plant against the traditional utility company. The real difference isn't just about where the electricity comes from; it’s about who holds the power over your budget. When you go solar, you’re essentially locking in your electricity rate for the next 25+ years.
On the other hand, utility rates are anything but predictable. They swing based on volatile fuel prices, expensive grid maintenance, inflation, and policy changes. If you look at the historical data, the trend is crystal clear: utility prices only go one way—up. This makes your monthly bill a constantly moving target.
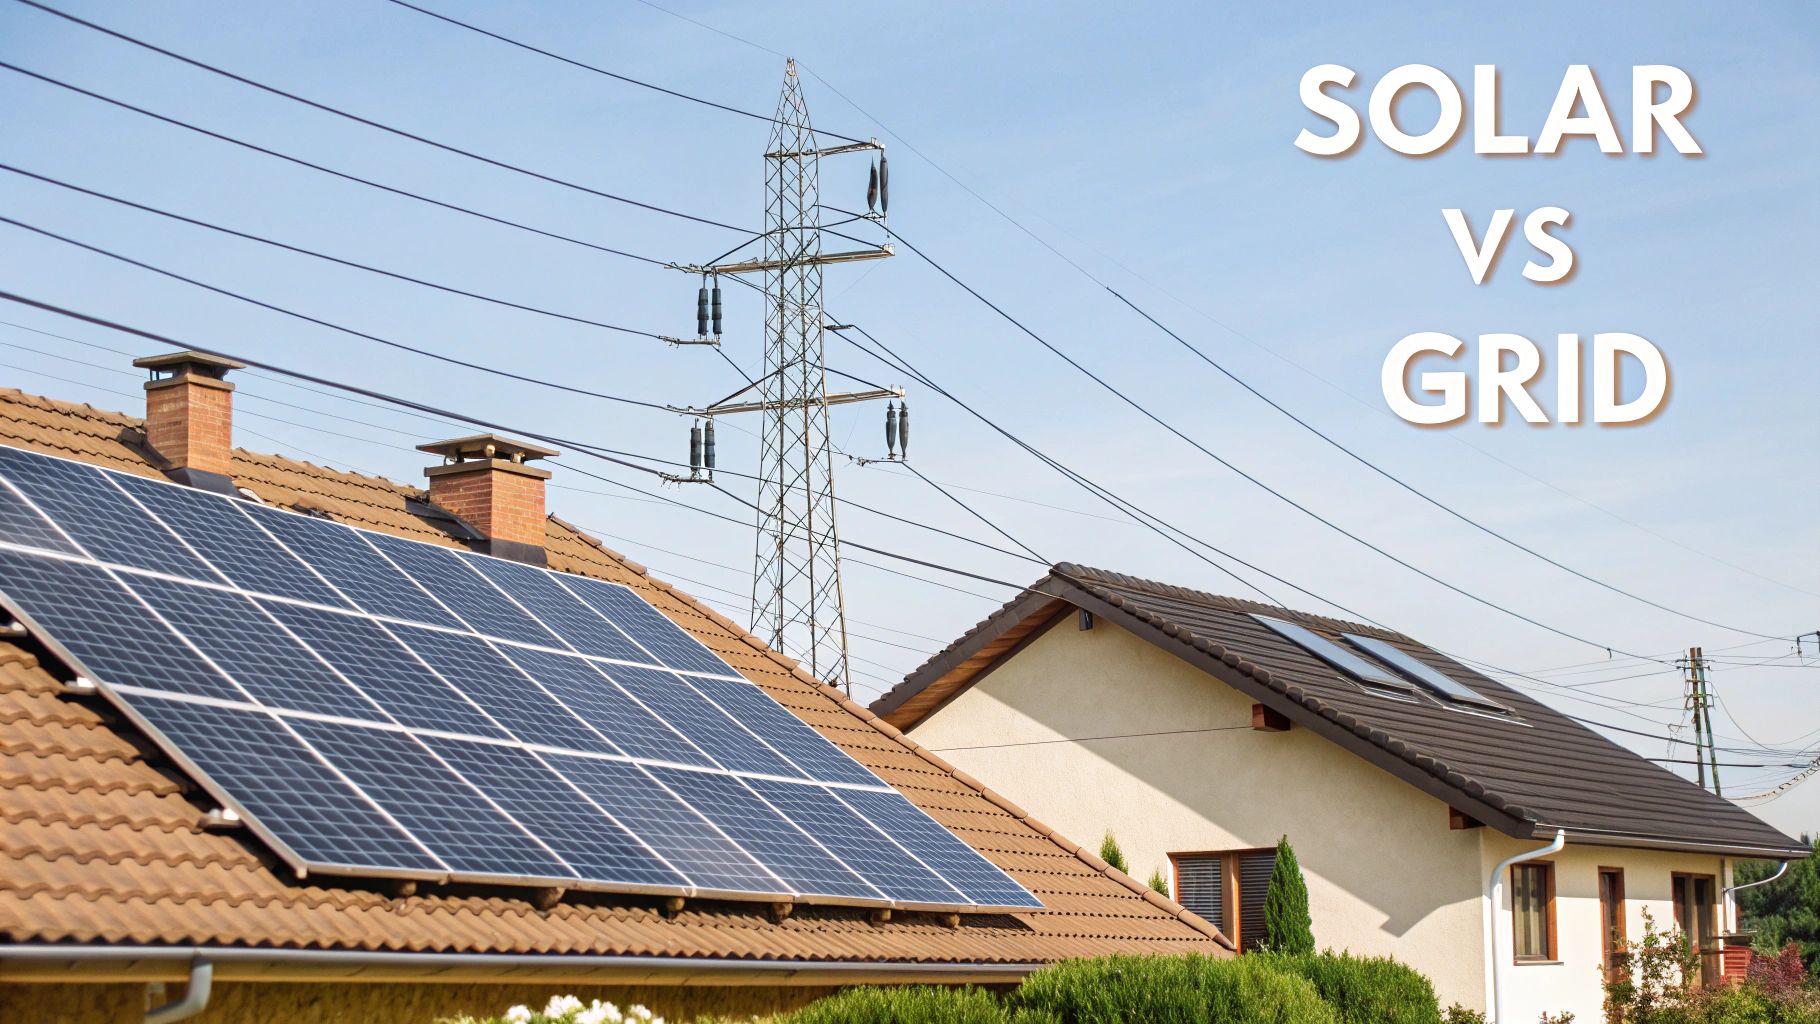
This graph says it all. You can see the utility cost line steadily climbing year after year, while the solar line stays flat and low. That flat line represents your fixed, predictable cost per kWh.
Pinpointing Your Solar Break-Even Point
The exact moment those two lines cross is what we call the solar break-even point, or the payback period. This is the financial milestone where the money you've saved on electricity bills completely covers the net cost of your solar panel system. Every single kilowatt-hour your panels produce after that day is pure savings.
So, how quickly can you hit that breakeven point? It really depends on a few key things:
- Your Net System Cost: The lower your upfront investment is after factoring in all the tax credits and rebates, the faster you'll get your money back.
- Local Utility Rates: If you live somewhere with sky-high electricity prices, like California or parts of the Northeast, your payback period will be much shorter because every kWh you generate saves you more money.
- System Production: A roof that gets tons of sun and is fitted with an efficient system will crank out more power, which naturally speeds up your savings.
For most homeowners, reaching this break-even point happens within 7 to 15 years. Everything after that is just icing on the cake, often adding up to tens of thousands of dollars in savings over the system's life. To get a really accurate picture for your own home, it's best to use a detailed solar return on investment calculator.
By generating your own power, you shift from being a lifelong renter of electricity to an owner of your energy source. This move provides a powerful hedge against inflation and rising utility costs, securing your financial future.
Long-Term Savings and Energy Independence
The real magic of solar truly reveals itself over the long haul. Once your system is paid for, you're looking at decades of nearly free electricity. This doesn't just slash your monthly expenses; it gives you a powerful sense of energy independence. You're no longer at the complete mercy of the grid, its outages, or its unpredictable rate hikes.
This self-sufficiency can extend beyond just your home. For example, if you own an electric vehicle, understanding the costs of electric vehicle charging becomes a whole new ballgame with solar. You can essentially fuel your car with sunshine, turning your home into a complete energy hub.
When you boil it down, comparing solar to the grid is a choice between two very different financial futures. One path has you paying a variable, ever-increasing rate for electricity for the rest of your life. The other involves an upfront investment that unlocks decades of low, stable energy costs, delivering huge savings and incredible peace of mind.
So, What's Next for Solar (and Your Wallet)?
We’ve walked through the numbers, and it’s clear: the cost of solar per kWh is already a solid contender against traditional utility power, shaped by the gear you choose and where you live. You even know how to run the numbers for your own home. But this is just the beginning—the solar energy world is constantly evolving, making an investment today look even better down the road.
Think about it. Solar panel technology isn't standing still. Every year, engineers are squeezing more efficiency out of each panel, meaning you can generate more power without needing more roof. At the same time, the cost of battery storage is dropping, making it easier and cheaper to keep your lights on when the sun goes down. This one-two punch is set to push the average cost of solar per kWh even lower, amplifying your savings over the long haul.
The Real Payoff of Going Solar
The trend is undeniable: energy independence is shifting from a lofty ideal to a practical, money-saving reality for homeowners. As the technology gets better and the prices continue to fall, the case for making the switch becomes a no-brainer.
The big picture is simple: Yes, the upfront cost is a real consideration. But the stable, predictable cost per kWh you lock in for decades makes solar an incredibly powerful financial tool for any modern homeowner.
At the end of the day, adding solar panels to your roof is more than just another home improvement project. It's a strategic move to fix your energy costs for the next 25+ years, shielding your budget from unpredictable utility rate hikes while doing your part for a healthier planet.
Got Questions About Solar Costs? We've Got Answers.
When you start digging into the numbers behind a solar installation, a few questions always pop up. Let's tackle some of the most common ones to give you a clearer picture of what to expect.
Will My Solar Cost Per kWh Be the Same as My Neighbor's?
Almost certainly not. Think of your solar cost per kWh as a financial fingerprint—it's unique to your specific situation. A whole host of factors come into play, from how much power your family uses to the direction your roof faces and whether that big oak tree casts a shadow at 3 PM.
It's a lot like buying a car. You and your neighbor might both buy the same model, but the final price will differ based on the trim, financing, and any rebates you each qualified for. Your home's energy profile and system design are just as personal, meaning your cost per kWh will be, too.
How Does Adding a Battery Affect the Cost Per kWh?
Tacking on a battery will definitely bump up your initial investment, which means your calculated cost per kWh will also go up. But that's only looking at one side of the coin.
A solar battery does more than just increase the upfront price—it fundamentally changes how you use energy. It gives you backup power during an outage and lets you sidestep the grid entirely. Even better, you can store the free energy you generate during the day and use it at night, avoiding those pricey peak electricity rates from the utility company. For many, that added control and long-term savings make it well worth the initial cost.
How Long Does It Take to Break Even on a Solar System?
This is the big one: the solar payback period. For most homeowners in the U.S., you're typically looking at a timeframe of 7 to 15 years to recoup your initial investment.
What pushes you to one end of that range or the other? It really boils down to three things:
- Your Utility's Rates: The more you're paying the power company, the faster your solar panels will pay for themselves. Simple as that.
- Your Final System Cost: This is the all-in price after you subtract every tax credit and rebate you can get your hands on.
- How Much Power You Use: Big energy users see bigger savings, which naturally speeds up the payback timeline.
After you hit that break-even point, you're in the clear. Every bit of electricity your panels produce for the rest of their 25+ year lifespan is pure savings in your pocket.
Ready to discover your personalized solar cost and potential savings? The experts at Radiant Energy can provide a custom assessment for your home. Get your free solar quote today!