Learning to read your electricity bill isn't about memorizing every line item. It’s about knowing where to look for the three most important pieces of information: your account information, the charge summary, and your energy usage. Once you can spot these, that confusing document becomes a surprisingly useful tool for managing your costs.
Your Guide to Understanding Your Electricity Bill
Let's be honest, staring at a utility statement can feel like trying to solve a puzzle with half the pieces missing. The good news is, you only need to focus on a few key areas to get the full picture of what you're paying for.
Understanding your bill is more important than ever, especially with energy prices swinging so wildly depending on where you live. For perspective, the average U.S. residential bill hovers around $167 for about 881 kWh of monthly use. But location changes everything. A family in Hawaii might see a bill closer to $282, while a household in Utah could pay as little as $95 for the same amount of power. You can explore more of these regional electricity cost differences on the Solar.com blog.
graph TD
    subgraph Monthly Electric Bill Comparison
        direction LR
        A[Average US Bill: $167]
        B[Hawaii Bill: $282]
        C[Utah Bill: $95]
    end
The goal here isn't just to find the "Amount Due." It's about seeing exactly where your money is going at a glance, transforming your bill from a monthly chore into a powerful tool for finding savings.
Deciphering Common Bill Terminology
Before we get into the nitty-gritty of your charges, let’s translate some of the jargon that utility companies love to use. Think of this as a cheat sheet for the rest of your bill.
Common Electricity Bill Terms Translated
This quick reference guide will help you decipher the most common terms and acronyms you’ll run into.
| Term/Acronym | What It Really Means | Why It Matters to You |
|---|---|---|
| kWh | Kilowatt-hour. This is the standard unit for measuring your electricity consumption. | This is the number that drives your bill. The lower your kWh usage, the lower your costs will be. Simple as that. |
| Demand Charges | A fee based on your single highest point of electricity usage during the billing cycle. | This charge is designed to penalize sudden spikes in consumption and reward consistent, steady energy use. |
| Service Fee | A flat, fixed monthly charge for being connected to the power grid. | You pay this every month no matter how much (or how little) electricity you use. It covers grid upkeep and administrative costs. |
Getting a handle on these basic terms is the first real step. Now, when you see "kWh" or "Service Fee," you'll know precisely what it means for your bottom line.
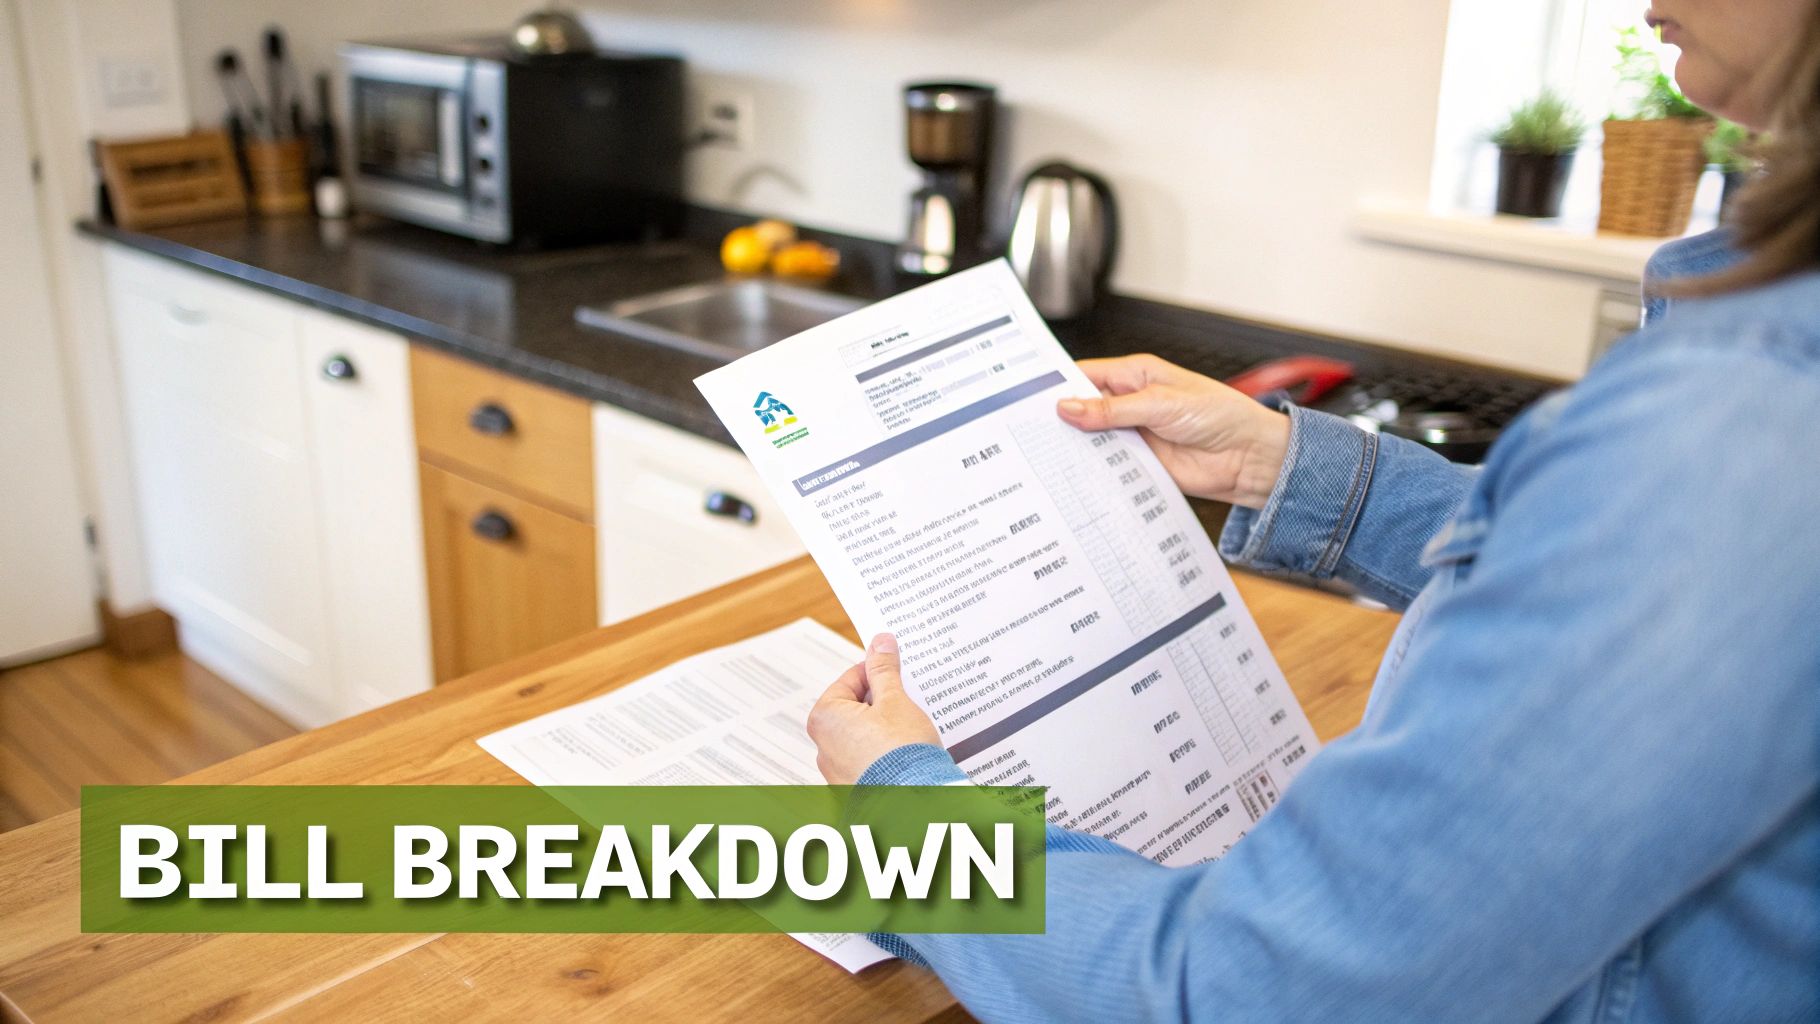
Breaking Down the Charges Line by Line
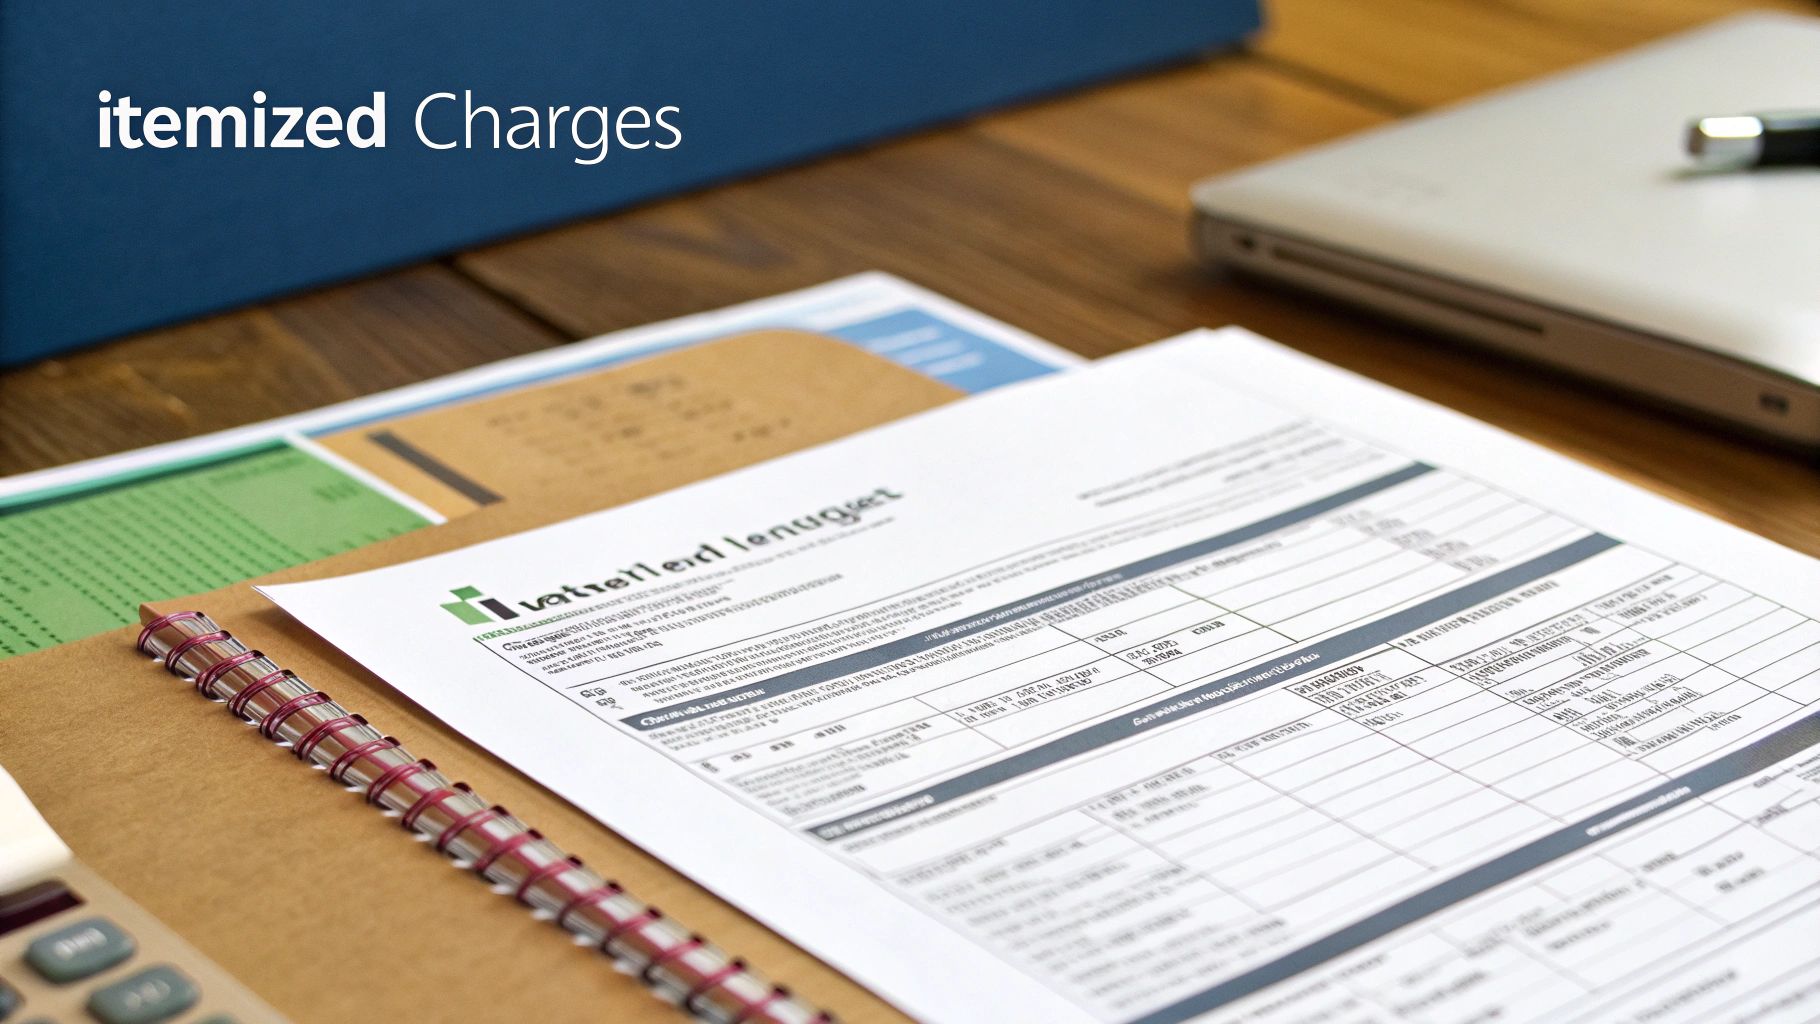
Alright, let's move past the summary at the top and get into the real nitty-gritty of your bill: the itemized charges. This section can look like a wall of confusing jargon and numbers, but it’s really just the utility company showing their work. Think of each line as one ingredient in the final recipe for your total amount due.
What you owe is almost never just the cost of the electricity you used. It’s actually a bundle of different costs covering everything from generating the power to delivering it, plus all the taxes and fees along the way. It’s a lot like a restaurant bill—you’re not just paying for the food (the energy), but also for the service to bring it to your table (delivery) and taxes.
pie
    title Typical Bill Breakdown
    "Energy Supply/Generation" : 60
    "Delivery/Distribution" : 30
    "Taxes & Fees" : 10
Your Basic Energy Charges
The biggest chunk of your bill will almost always be the supply or generation charge. This is the raw cost of the electricity you actually used, measured in kilowatt-hours (kWh). So, if your home used 950 kWh this month and your rate is $0.11 per kWh, the math is simple: this part of your bill comes out to $104.50.
This is the number you have the most direct control over. Every light you turn off or appliance you unplug directly chips away at this charge. If you’re trying to lower your bill, this is where you should focus your efforts first.
Delivery and Distribution Fees
Next up, you’ll likely see delivery or distribution charges. In some places, these are called TDU (Transmission and Distribution Utility) fees. Essentially, this is what you pay your local utility to keep the lights on—literally. It covers the cost of maintaining the web of power lines, poles, and transformers that bring electricity from a distant power plant right to your home.
These fees are typically broken down into two parts:
- A fixed monthly customer charge: This is a flat fee you pay every month just for the privilege of being connected to the grid, even if you use very little power.
- A variable charge: This part is based on how much electricity you used (your kWh), just like the supply charge, but it’s calculated at a different, often lower, rate.
These delivery fees are a good reminder that your bill reflects a lot more than just making power. If you look at bills from countries like Germany or Ireland, you'll see multiple line items for network maintenance and environmental levies. It's not uncommon for these delivery and policy-related costs to make up a huge portion of the final bill. You can get a better sense of how international electricity prices are structured on Statista.
Key Takeaway: You're paying for two distinct services: the electricity itself (supply) and the infrastructure that gets it to you (delivery). Grasping this difference is the key to understanding why your bill is structured the way it is.
The last few items on the list are usually smaller, miscellaneous charges. These can include state and local taxes, fees for public programs, or other regulatory adjustments. They might seem small on their own, but they definitely add up. Taking a moment to review them gives you the full, unfiltered picture of where your money is going.
Making Sense of Your Energy Usage Data
Beyond the lists of charges and fees, you'll usually find the most interesting part of your bill: the charts and graphs. This is where the numbers come to life. Think of this section as a personal energy audit, giving you the power to spot trends, identify problems, and find real opportunities to save money.
Most utility companies include a simple bar graph showing your energy consumption over time. This visual is your best friend for a quick check-up. It lets you see your monthly electricity use in a single glance, making any unusual spikes or dips impossible to miss.
Unlocking the Story in Your Usage History
Your bill likely includes a history of your usage for the last 12 months, and this is where the real detective work begins. This historical data is the key to truly understanding your home's energy habits.
Take a look at the bars. How does this month's usage stack up against last month? More importantly, how does it compare to the same month last year? This year-over-year comparison is critical because it accounts for seasonal changes.
gantt
    title Sample Energy Usage Comparison (kWh)
    dateFormat  YYYY-MM-DD
    section July
    Last Year :crit, 2023-07-01, 800h
    This Year :active, 2024-07-01, 950h
For example, did your usage suddenly jump by 150 kWh compared to last July? That’s a red flag. It could point to an aging, inefficient air conditioner that’s working overtime, or maybe that new deep freezer in the garage is a bigger energy hog than you thought.
Pay close attention to one small but crucial detail: whether your meter reading was "actual" or "estimated." An actual reading is just what it sounds like—the real number from your meter. An estimated reading is the utility's best guess based on your previous habits.
An "estimated" bill can set you up for a nasty surprise. If the utility company guessed too low this month, you'll be on the hook for the difference on your next bill, which can lead to a real shock when you open it. It’s always worth checking.
Of course, this analysis isn't just about finding what's wrong; it's also about seeing what's right. If you’ve been making a conscious effort to turn off lights or run appliances at night, these charts give you the satisfaction of seeing those efforts pay off in lower kWh.
For anyone wanting to take this a step further, a dedicated solar monitoring system offers incredibly detailed, real-time insights into not just how much power you're using, but also how much you might be generating.
By getting into the habit of reviewing these charts each month, you change your relationship with your utility bill. It stops being just another expense and becomes a powerful tool. You can pinpoint exactly when your usage is highest and start asking the right questions to figure out why, putting you back in the driver's seat of your energy costs.
Understanding Different Electric Rate Plans
One of the biggest eye-openers for homeowners is realizing that not all electricity costs the same. How and when you're charged is all down to your utility's rate plan, and knowing which one you have is the key to outsmarting your bill.
You're likely on one of three common rate structures. The most straightforward is the flat-rate plan. It’s simple: you pay the exact same price for every single kilowatt-hour (kWh) you use, whether it's 3 AM or 3 PM. No surprises.
Tiered vs. Time-of-Use Plans
From there, things can get a little more interesting. Many utilities use tiered rates, where the price changes based on how much electricity you use over the billing cycle. It's like a volume discount in reverse.
For instance, your first 500 kWh might be a reasonable $0.12/kWh, but once you cross that threshold, every kWh after could jump to $0.16/kWh.
graph TD
    subgraph Tiered Rate Example
        A[0-500 kWh] --> B[$0.12/kWh]
        C[501+ kWh] --> D[$0.16/kWh]
    end
Then there's the Time-of-Use (TOU) plan, which is becoming increasingly common. With a TOU plan, the price of electricity changes depending on the time of day. It’s all about grid demand. Rates are highest during "peak" hours—typically late afternoon and early evening when everyone gets home from work and starts using their appliances.
Real-World Impact: Think about this: two families could use the exact same amount of electricity in a month, but have vastly different bills. The family on a TOU plan that charges their EV overnight will pay far less than the one that plugs it in right at 6 PM.
So, how do you know which plan you're on? Your bill should have a section labeled "Rate Plan," "Service Details," or something similar. Once you know your plan, you can start making smart adjustments. If you're on a TOU plan, simply shifting when you run the dishwasher or do laundry to off-peak hours can make a real difference.
You can learn more about how to make time-of-use electricity rates work for you. It's all about aligning your household's energy habits with your plan to lower your costs without sacrificing your comfort.
Practical Ways to Lower Your Next Bill

Now that you can read your electricity bill like a pro, it's time to put that knowledge to work. The numbers on your bill aren't just a record of what you owe; they’re a roadmap showing you exactly where you can find savings. Forget generic advice—let's connect real strategies to the insights you just uncovered.
For example, did your usage graph show a consistent spike on weekday afternoons? That's a huge clue to start looking at what’s running during those peak hours. This is about more than just reading the bill; it's about using it to get some practical advice to reduce your energy bills without sacrificing comfort.
Your bill doesn’t just tell you what you’ve spent—it tells you how you spent it. Use this information to target the specific habits and devices that are costing you the most.
From Insights to Action
Let's turn that data into real dollars saved. The best place to start is by hunting down the biggest energy hogs in your home, especially the "energy vampires" that suck power even when they're off or in standby.
An easy win is to unplug chargers, gaming consoles, and TVs when you're not using them. Better yet, plug them into a smart power strip that automatically cuts the power for you. These small habits really do add up over the course of a year.
Next, look at your bill's historical data to set a smart goal. If you used 950 kWh last July, why not challenge yourself to hit 875 kWh this year? A few targeted changes could get you there.
Low-Cost Upgrades with High Impact
You don't have to break the bank to see a big difference. Here are a few smart, affordable upgrades that deliver impressive returns.
| Upgrade Idea | Average Cost | Potential kWh Savings (Annual) |
|---|---|---|
| LED Light Bulbs | $2 – $5 per bulb | 50-70 kWh per bulb |
| Smart Thermostat | $100 – $250 | 300-600 kWh |
| Weather Stripping | $10 – $20 per door/window | 150-300 kWh |
Taking these steps is more important than ever, especially with global energy trends pointing toward higher prices. Worldwide electricity demand is projected to climb by about 3.3% each year, putting more strain on the grid—which often means higher rates for you and me.
If you're looking for a more lasting solution, it's worth exploring how much you can save with solar panels. It's a powerful way to offset rising utility costs and gain more control over your energy future.
Common Questions About Your Electricity Bill
Even after you've gotten the hang of reading your electricity bill, a few tricky questions can still come up. Let's walk through some of the most common issues that leave homeowners scratching their heads and get you some clear, straightforward answers.
What Should I Do if My Bill Seems Unusually High?
First off, don't panic. The answer is usually right there on the paper.
Grab your bill and find the usage graph. The first thing you want to do is compare this month’s kilowatt-hour (kWh) consumption to last month's. More importantly, check it against the same month from last year—that helps account for any seasonal spikes, like running the AC more in July.
Next, look for whether your meter reading was marked as “actual” or “estimated.” Sometimes, the utility company estimates your usage, and if they guess low one month, you'll get hit with a surprisingly high "catch-up" bill the next time they take an actual reading.
A Pro Tip From Experience: An unexpected spike can often be traced back to a single culprit. Did you recently buy a new appliance, like a deep freezer? Have you had guests staying over? Or maybe a heatwave forced your HVAC system to work overtime.
If you still can’t pinpoint a logical reason, it might be time to look for a faulty, energy-guzzling appliance. If that doesn't solve it, your next step is to contact your utility provider to ask about potential billing errors or issues with your meter.
What Is the Difference Between a Supplier and a Distributor?
This is a classic point of confusion, but it’s actually pretty simple. Think of it like ordering a package online.
- The Supplier: This is the company that sells you the electricity. They’re the ones who either generate the power or buy it on the wholesale market. They're like the online store you bought your item from.
- The Distributor: This is your local utility company. They’re the ones who actually deliver the electricity to your home through the physical poles and wires they own and maintain. Think of them as the shipping company that brings the package to your door.
In many states, you can choose your energy supplier, but your distributor is determined by where you live. You'll often see separate charges from both on your bill, which is completely normal.
How Can I Find My Utility's Peak Hours?
If you're on a Time-of-Use (TOU) plan, knowing this information is like having a cheat code for saving money.
Your bill is the best place to start. The exact peak, mid-peak, and off-peak hours are almost always listed in the detailed charges section or somewhere near your rate plan information.
Can't find it there? Your utility provider's website is your next best bet. Head to the section on residential rate plans. And if all else fails, a quick call to their customer service line is a surefire way to get the specific times for your exact plan.
Take control of your energy future and significantly reduce your reliance on fluctuating utility rates. Radiant Energy offers high-quality solar solutions designed to provide energy independence and a cleaner environment for your home. Explore our solar systems and get a free consultation today!